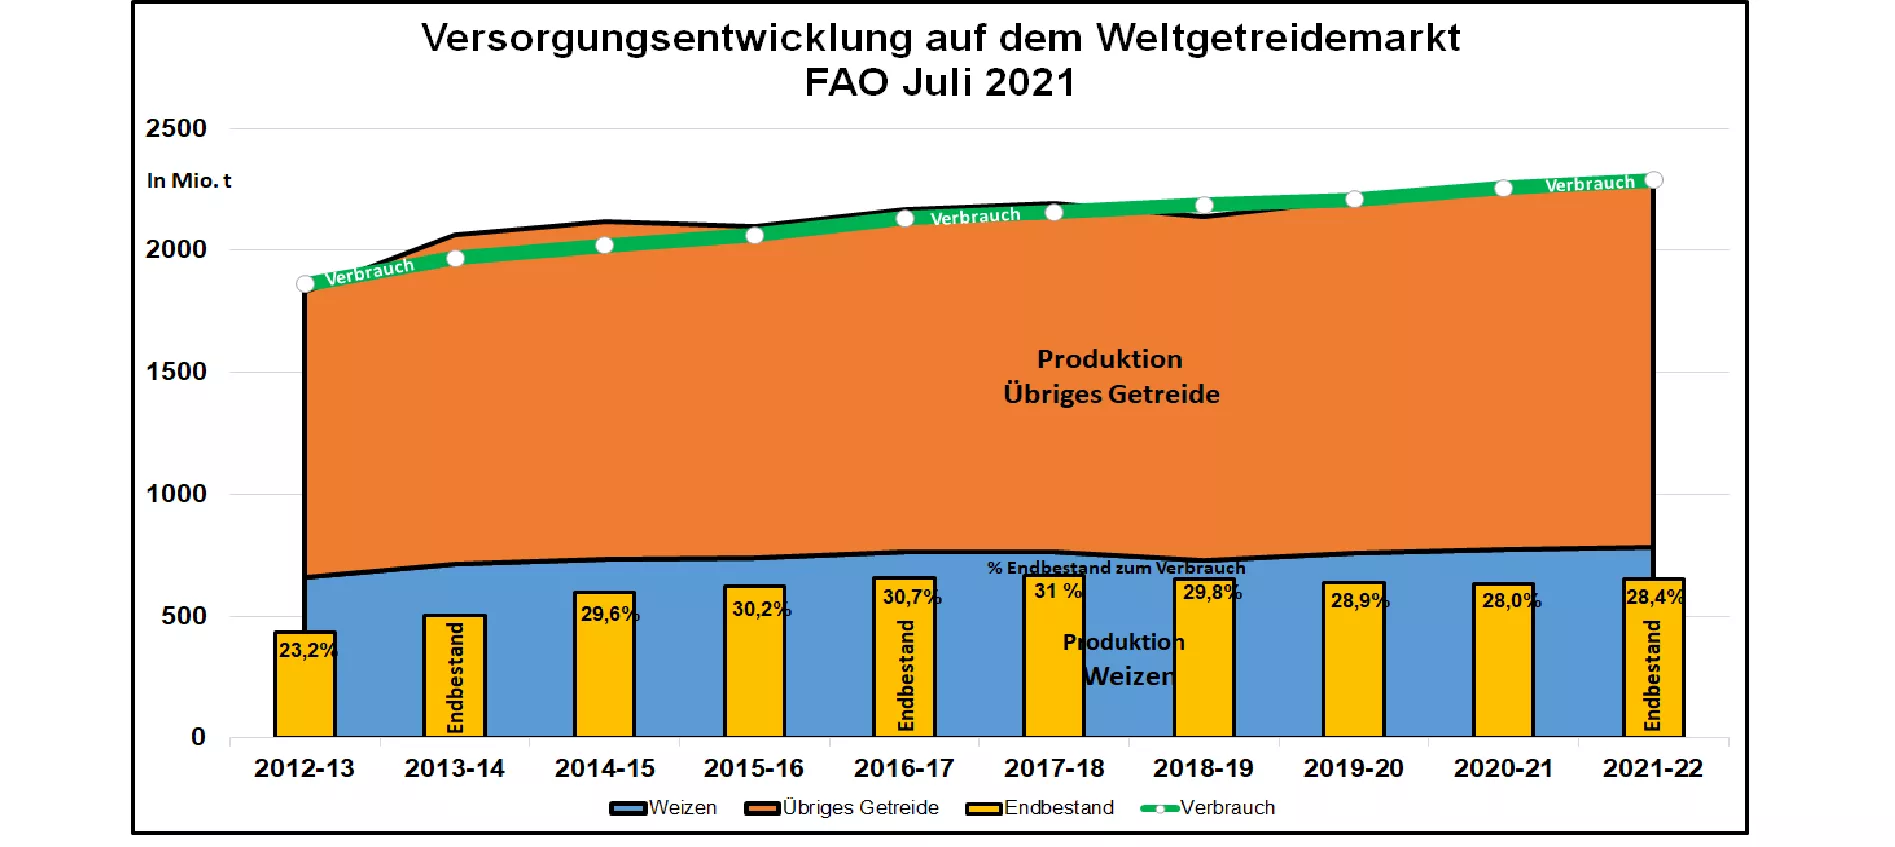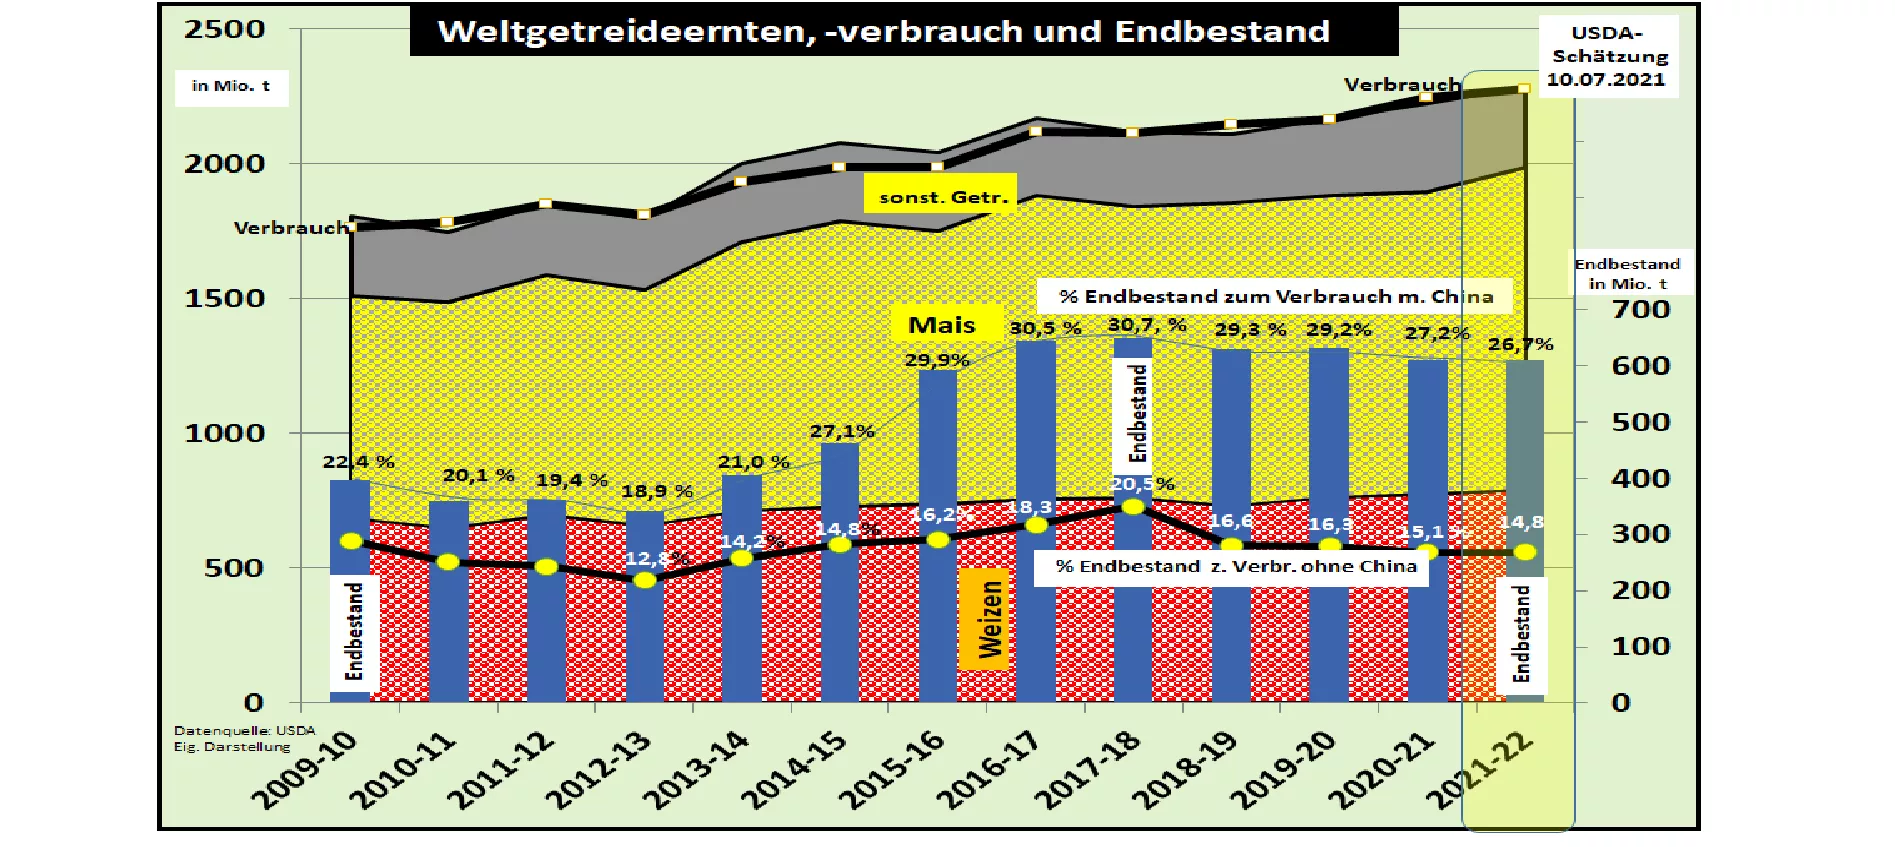
Global Harvest Estimates in July 2021 USDA's 3rd Grain Harvest Estimation 2021/22: Wheat withdrawn The US Department of Agriculture (USDA) has published its 3rd estimate of the world's grain supply in 2021/22. The first stock exchange prices in the USA rose strongly, in Paris only moderately. The USDA estimates that the total harvest, which was cut in the previous month, is only 2.6% higher than the previous year to 2,289 million t. This is compared with a 3.1% increase in consumption of 2,280 million t. This results in final stocks of 611 million t, slightly lower than in the previous year. The supply figures including China only decrease to 26.7% and without China to 14.8 % final inventory for consumption. This corresponds to an average supply situation averaged over the last 6 years.Under today's market conditions, especially with a new strong but uncertain customer from China, the supply is to be assessed more critically. China's imports are estimated at 56.7 million t. Two years ago Chinese imports were still at 23 million t. The USDA is still cutting the global wheat harvest to a record level of 792.4 million t or +2.1% higher than in the previous year. The EU made a decisive contribution to this with an increase of + 9.7% to 138.2 million t compared to the weak previous year. For Argentina , unchanged compared to the previous month, an increasing wheat harvest of 20.5 million t (previous year 17.6 million t) is forecast. After the unfavorable previous year, Ukraine should even reach 30 million t (previous year 25 million t). Contrary to the previous month's forecast, the Russian wheat harvest is only expected to be 85 million t . A smaller winter wheat area due to wintering and low yield expectations for summer wheat due to drought are the causes. . in Australia the harvest will be increased somewhat to 28.5 million tons.(Previous year 33 million t). Canada's wheat harvest is estimated to be lower due to the hot period : 31.5 million t compared to 35.2 million t in the previous year. The USDA estimates global wheat consumption at around 791 million t . Consumption figures are expected to rise in the EU, Africa and Southeast Asia. Worldwide stocks are being reduced to 291 million t or 37% of the final stock for consumption. Without China , a supply figure of around 23% of the final stock for consumption is calculated. That is enough for around 84 days (previous year 88). Global wheat exports are expected to grow by 3.1%. In particular, Russia with an increased 40 million t, Ukraine with an increased 21 million t, the EU with an increasing 34 million t, Australia with an unchanged 20 million t and Argentina with a slightly increasing 13.5 million t are involved.Together these 5 regions account for almost two thirds of world trade in wheat. On the import side , Egypt leads the way with 13 million tonnes of wheat imports; The Black Sea countries and the EU compete for this sales area. This is followed by Indonesia with 11 million t, China and Turkey with a further 10 million t each. The North African countries Algeria and Morocco together have 12.5 million tonnes of wheat imports, most of which are served from France. The USDA estimates global corn production - 5 mln t higher than in the previous month - 6.1% higher to 1.1,194.8 mln t compared to the previous year. For the USA , the USDA expects an increase of 6% to 385 million tons . In the Ukraine, the USDA remains at a 24% increase to 37.5 mln t compared to the weak previous year. In China , the maize harvest is estimated unchanged from the previous month at 268 million t.The maize harvests in Brazil are still estimated at 118 million t, after the delayed sowing after the previous crop soy is now also affected by persistent drought. The Brazilian harvest result, however, remains quite uncertain. According to US estimates, global corn consumption is expected to be slightly higher than production at 1,183.5 million t. The final stocks drop only slightly from 292 to 291 million t. The worldwide coverage figure changes insignificantly to 24.6%. Without China , however, the supply standard is only 10.4% final inventory for consumption and is therefore only sufficient for 38 days . (Previous year 45). However, there are significant risks to be taken by the autumn 2021 harvests , especially when looking at the North American heat wave. The USDA increases global corn exports by 6.7%.The South American countries Brazil (increased 43 million t ) and Argentina with a reduced 36 million t contributed the largest share of the increase. Then comes the Ukraine with an unchanged 30.5 million t. The US is to reduce its corn exports from last year's 70 to 62 million t this year . On the import side , China dominates with an increasing import volume of 26 mln t, ahead of Mexico with an increased 17 mln t and the EU with almost 16 mln t and Japan with an increased 16 mln t. The stock exchange prices in Chicago rose after the USDA publication from just under 190 € / t to 197 € / t wheat . The corn prices rose to the equivalent of € 220.4 / t . Due to the more favorable harvest estimates for the EU, the Paris quotes reacted with only slight price increases.For the EU-27 , the USDA estimates a total harvest of around 291.6 million t , including 138 million t of wheat. In the previous year, the comparable EU-27 harvest was 279 million t, including 126 million t of wheat. Falling imports and rising exports change the closing stocks only slightly. FAO-OECD estimate the global harvest in 2021/22 will be 2,287 million t Using a survey method that deviates from the USDA, the Agriculture and Food Organization of the United Nations estimates in its July edition a world grain harvest of 2,288 million tons , of which around 785 million tons are wheat. Due to the different methodology, the absolute results are less suitable for comparison than their change numbers. The FAO-OECD increase compared to the previous year is only around 1.45% in production and consumption compared to the USDA production estimate of 2.6% and a consumption increase of 3.1 %.The FAO-OECD care figures are trending slightly upwards, while the USDA figures indicate a decreasing supply trend. Overall, the differences are still in the estimation error range.