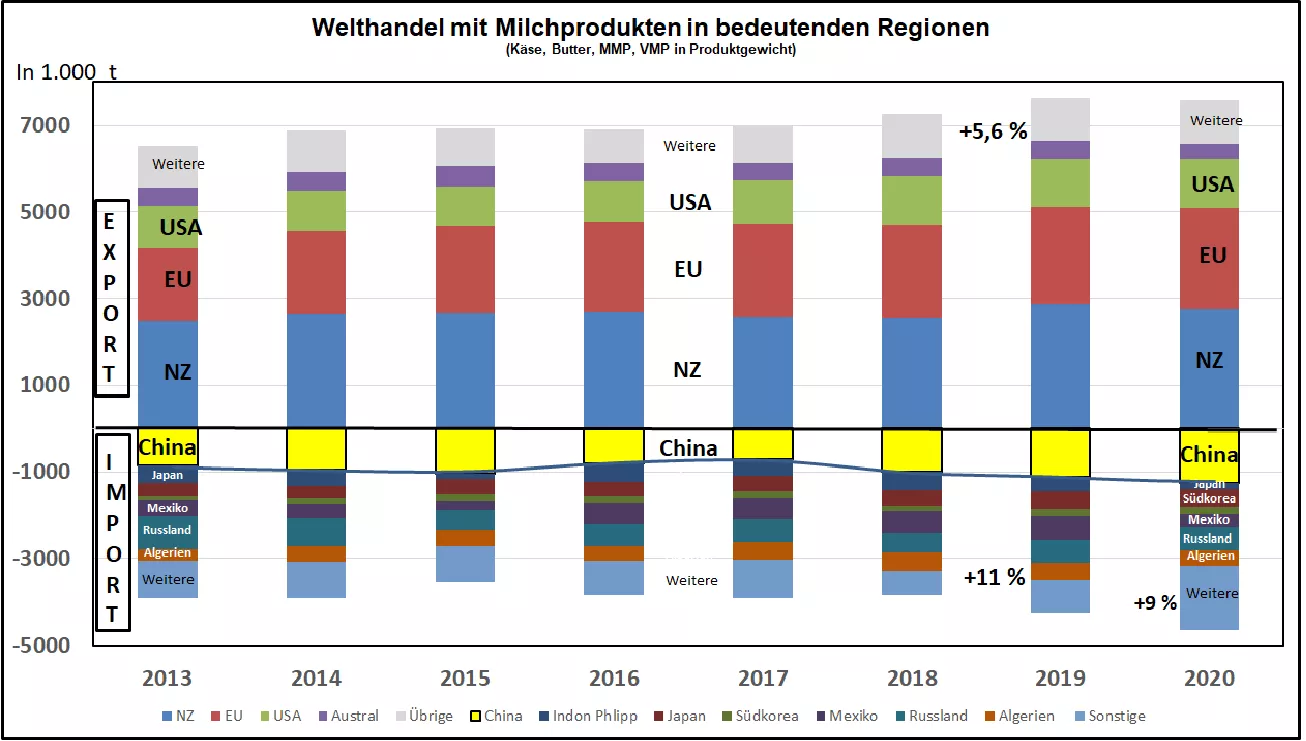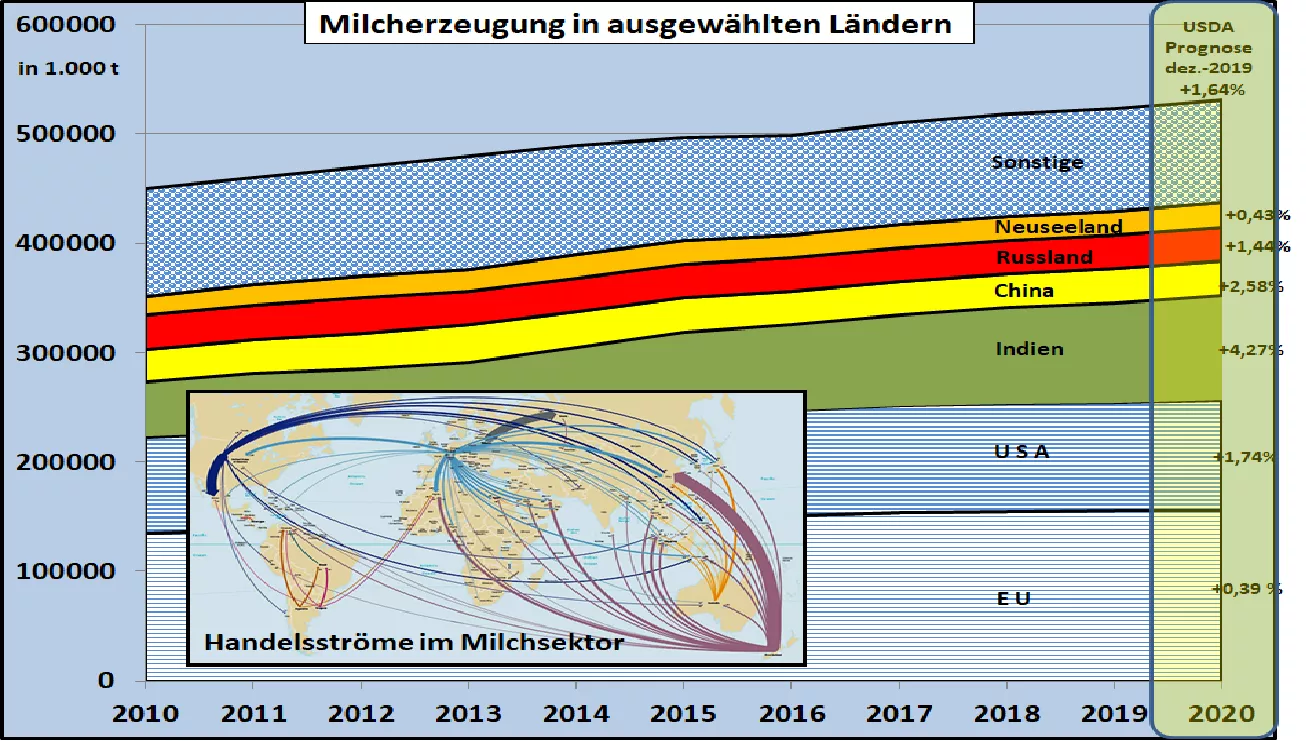
USDA: Preview of the 2020 World Milk Market The Department of Agriculture (USDA) estimates in its semi-annual edition of the World Milk Market an increase in production of 1.64% for 2020 . India with a below-average +4.27, China with +2.58% and the USA with +1.74% have a major share in this. For the EU-28 , 0.39% is predicted. As a self-sufficient country, India will have hardly any influence on global market and price developments. China urgently needs replacement protein carriers for the ASP-related loss of pork production. The increases in the United States could have an impact on skimmed milk powder exports. The increase is largely due to the 1.36% increase in dairy cow herds. The decisive factor here is India, while in the other countries with a high milk production level the dairy cow population tends to be reduced.The milk output ranges from 10,807 kg / cow in the USA and Canada down to 1,526 kg / cow in India. The average for the EU is 6,832 kg / cow. At the world level , the average is 3,689 kg / cow. The list of milk producing countries is led by the EU-28 with a share of 29%, followed by the USA with approx. 19% and India (only cow's milk) with just under 18%. The world's largest dairy exporter, New Zealand , only has a 4.1% share of milk production . China and Russia each have 5.8% share of production. Worldwide milk use is on average 36% fresh milk .This share is expected to increase in 2020. The differences between countries range from 85% in India to 2.3% in New Zealand . In the EU flow around. 21% in the fresh sector. Most of the milk, measured by product weight, flows into cheese production . For 2020, the USDA estimates an increase of 1.5% to approx. 20.6 million tons. Around half of these are produced and consumed in the EU . Another 30% of the global cheese market takes place in the United States . Russia is in third place with a share of 6%, a significant part of which is imported. At world level, approx. Statistically recorded 10 to 11 million tons of butter . Of these, approximately in 2020 in India. 6 million t produced and consumed slightly less. 2.4 million t are produced in the EU-28 and 2.2 million t are consumed domestically. The butter market in the USA only reached 0.9 million t.Skimmed milk powder (MMP) will be produced on a global scale of just under 5 million t in the coming year. The EU-28 generates approx. 1.8 million tons. and the USA approx. 1.1 million tons. Both countries export MMPs in large quantities between 1 million t and 0.7 million t to a large number of small importing countries. Of the 5 million tonnes of whole milk powder (VMP) produced worldwide in 2020, New Zealand and China each produce approx. 1.5 million t, both countries together approx. two thirds of the world crowd. While New Zealand exports almost 100%, the Chinese consumption of 2.2 million t. 0.7 million tons are imported. The goods come mainly from New Zealand on a short route. The prices of milk and milk products are interrelated at world level, although country-specific differences can be observed. The average EU milk price at the end of 2019 was 34.9 ct / kg at a medium level .In the surplus country New Zealand , the converted prices for milk are a little over 29.2 ct / kg . In the scarcely supplied USA , the milk price rose from 35 to 42.5 ct / kg in the last 5 months of 2019. The relative strength of the dollar exchange rate also plays a role. The prices for the central milk products cheese, butter and milk powder are related to one another as a result of international trade via export and import, but show similar country-specific differences as milk prices. The closest to each other are the MMP courses in the range between $ 2,700 to $ 3,000 / t. In the case of VMP , the courses in the USA are quoted at approx. 17.5% higher than in the EU and New Zealand. However, VMP only plays a marginal role in the USA. US butter fell sharply in the last months of 2019 after a stable summer period, but is still trading at $ 4,200 / t higher than prices in the EU and NZ at just over 4.$ 000 / t There is a considerable price difference for Cheddar cheese . In the scarcely supplied US market , Cheddar prices are almost 25% higher than in the EU , which is only trading at $ 3,489 / t. Almost $ 4,000 / t are paid in the New Zealand export area. Conclusion: Global milk production will continue to increase in 2020, especially in India and the USA, while only marginal increases are expected in the largest production area EU-28. The consumption of milk products from fresh milk to cheese, butter and milk powder is also increasing. International trade continues to show upward trends. At the end of 2019, prices for milk and milk products will be in the middle of the range compared to previous years. The US prices stand out clearly due to the scarcity situation in the country. In the New Zealand surplus area, prices are slightly below average, but have caught up somewhat. EU prices are in the middle of the range. The futures quotations for 2020 point to a continuation of the previous development with a tendency to slight improvements.