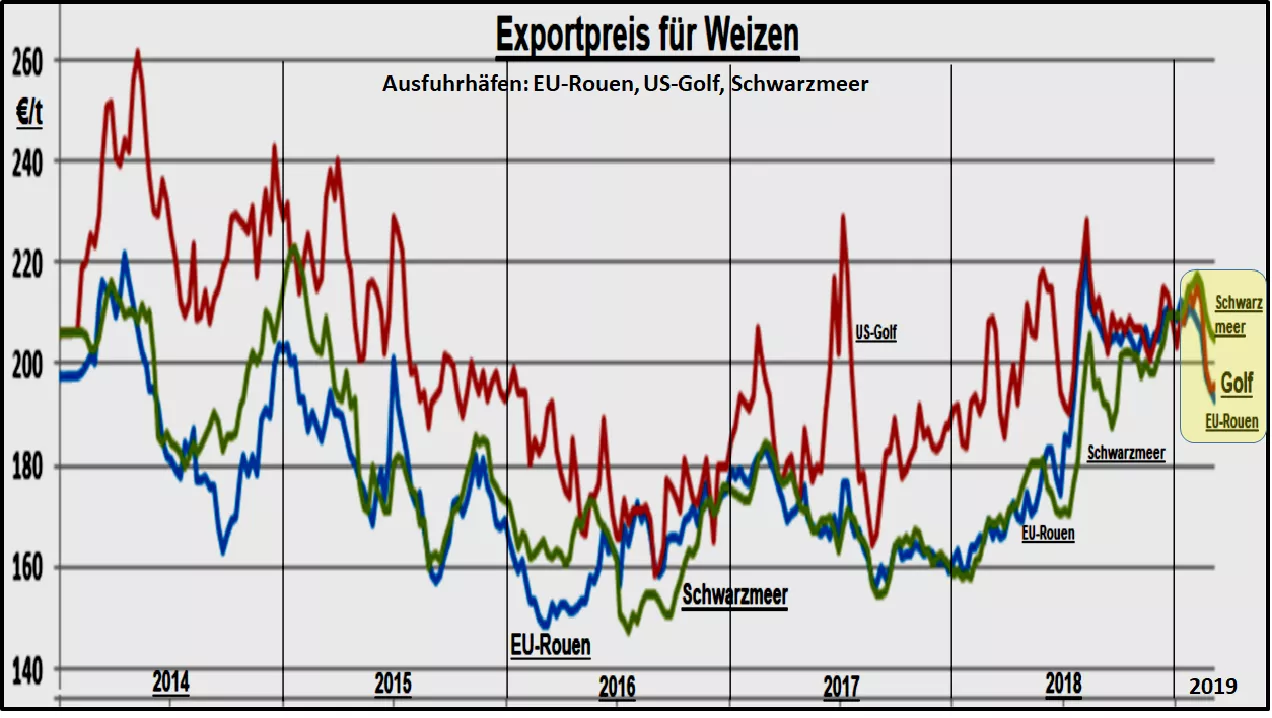
Turnaround in wheat export trade - consequences for further price development For more than 2 years, Russian wheat exports dominated international trade, with a focus on the North African importing countries and the Middle East. The high Russian crops caused corresponding export pressure to fall. The EU relies on wheat exports of 20 to 25 million tonnes , but drought-induced low harvests initially lead to high prices in 2018/19, but these were not competitive in international trade. EU wheat exports were correspondingly weak . The situation was similar for the United States with its relatively high export quotas, as well as comparatively higher transport costs. This price situation has changed recently .The export boom of the Black Sea countries - especially Russia - is reaching the limits of wheat availability . Rising scarcity has led to rising export prices in the Black Sea ports . The competitive superiority is dwindling. Now the EU and US wheat export rates are below those of the Black Sea ports. The most recent wheat tenders from the importing countries - above all Egypt - are no longer predominantly attributed to the exporters from the Black Sea area. The EU has increasingly been able to assert itself with its offers . The US Department of Agriculture expects EU exports to climb to 3 million tonnes per month in the coming months, as in 2016, given the EU price advantage . The deliveries are mainly from France and Romania . The USDA now estimates EU wheat exports at an increased 23 million tonnes relative to 2018/19.Rising exports reduce EU surplus stocks to an estimated 10 million tonnes . It follows that a total of 157 million t of 147 million tonnes will be available for a forecasted EU wheat harvest in 2019/20 . Assuming a perennial wheat consumption of approx. 130 million tons and an average export of 27 million tons is just a need-covering supply balance out. In the past year , the offer consisted of 14 million tonnes of initial stock and 136 million tonnes of harvest for a total supply of 150 million tonnes. On the consumption side, there were a reduced volume of 125 million tons and 23 million tons of export, together 148 million tons. Due to the interchangeability of cereals, the overall balance is more meaningful .
| offer | 2018/19 | 2019/20 * | use | 2018/19 | 2019/20 * |
| Opening balance | 30.3 | 23 | domestic consumption | 291 | 290 |
| harvest | 284.6 | 299 | export | 30 | 35 |
| import | 29.1 | 26 | Closing balance | 23 | 23 |
| total | 344 | 348 | total | 344 | 348 |
| *valued |
The above estimation results for 2019/20 indicate that, as things stand, a similarly balanced supply balance as in the previous year can be expected.A fairly safe initial small batch , lower imports due to higher self-production, slightly reduced consumption due to lower livestock numbers, and multi-year average exports are the key items for the bottom line. The largest uncertainty component is the weather-dependent yield per hectare with little reduced acreage. Under the above conditions, a stable price level could be set, which could be in the upper midfield of recent years. Looking at the later forward prices on the leading stock exchanges, this assessment seems quite widespread.

